
CRM & Data
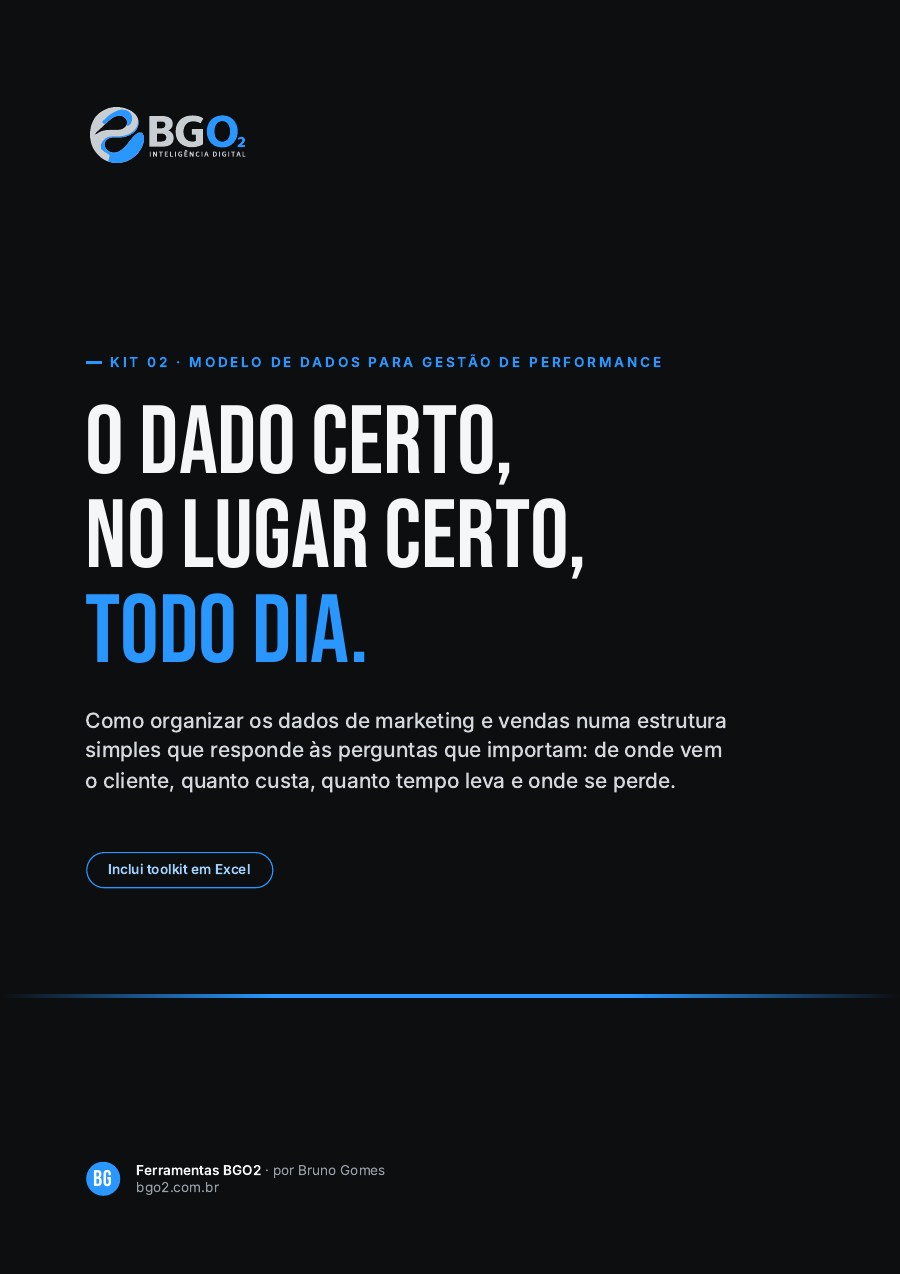
The right data, in the right place, every day.
How to organize marketing and sales data into a simple structure that answers what really matters: where customers come from, what they cost to acquire, and how much revenue they generate.
PDF guide (22 pages) + Excel spreadsheet · Free
The guide and spreadsheet are currently in Portuguese.
Who it is for
- Every department has a different number for the same metric.
- You don't know which campaign generated the closed deal.
- The agency's report doesn't match the company's bank balance.
- Data lives in disconnected spreadsheets, WhatsApp threads, and people's heads.
- No one can say for sure what it costs to acquire a customer.
What you get
The PDF guide
22-page PDF guide with a complete end-to-end example: Architecture · Key questions · Metrics dictionary · Data capture and fields · Single source of truth · Data hygiene · Dashboard and operating cadence. Concludes with a one-page summary, common pitfalls, a glossary, and a first-days checklist.
The Excel spreadsheet
Excel spreadsheet with 7 linked tabs, pre-filled with a working example (Contaflow, a financial management software for SMBs): Dictionary · Fields · Data log · Funnel by source · Data hygiene · Dashboard · Action plan. Simply replace the highlighted yellow fields with your data and the rest calculates automatically, complete with green, yellow, and red status flags.
How to use it
- 1
Build the data dictionary
Define each metric in a single sentence, agreed upon by marketing and sales.
- 2
Track the source
Use a single record of contacts and sales, tracking the source of each.
- 3
Review the weekly dashboard
5 business questions answered every Monday.
What changes in your business
Meetings stop debating which number is right and start making decisions. You discover where closing customers come from and how much it costs to acquire them.
Frequently asked questions
Do I need a BI tool to get started?
No. The kit starts in a spreadsheet. The tool comes after definitions and data sources are aligned.
What is a metrics dictionary?
It is a list defining each metric (lead, opportunity, customer, CAC) in a single sentence, agreed upon across all departments.
How long does it take to build a reliable dashboard?
The kit proposes a 3-week roadmap: definitions, source tracking, and the weekly dashboard.
Other tools on this front


Free material
Where does your growth stall?
A practical 60-minute diagnostic to run with your leadership team. Walk away with your bottleneck, the evidence, and a 7-day plan.